 User Login
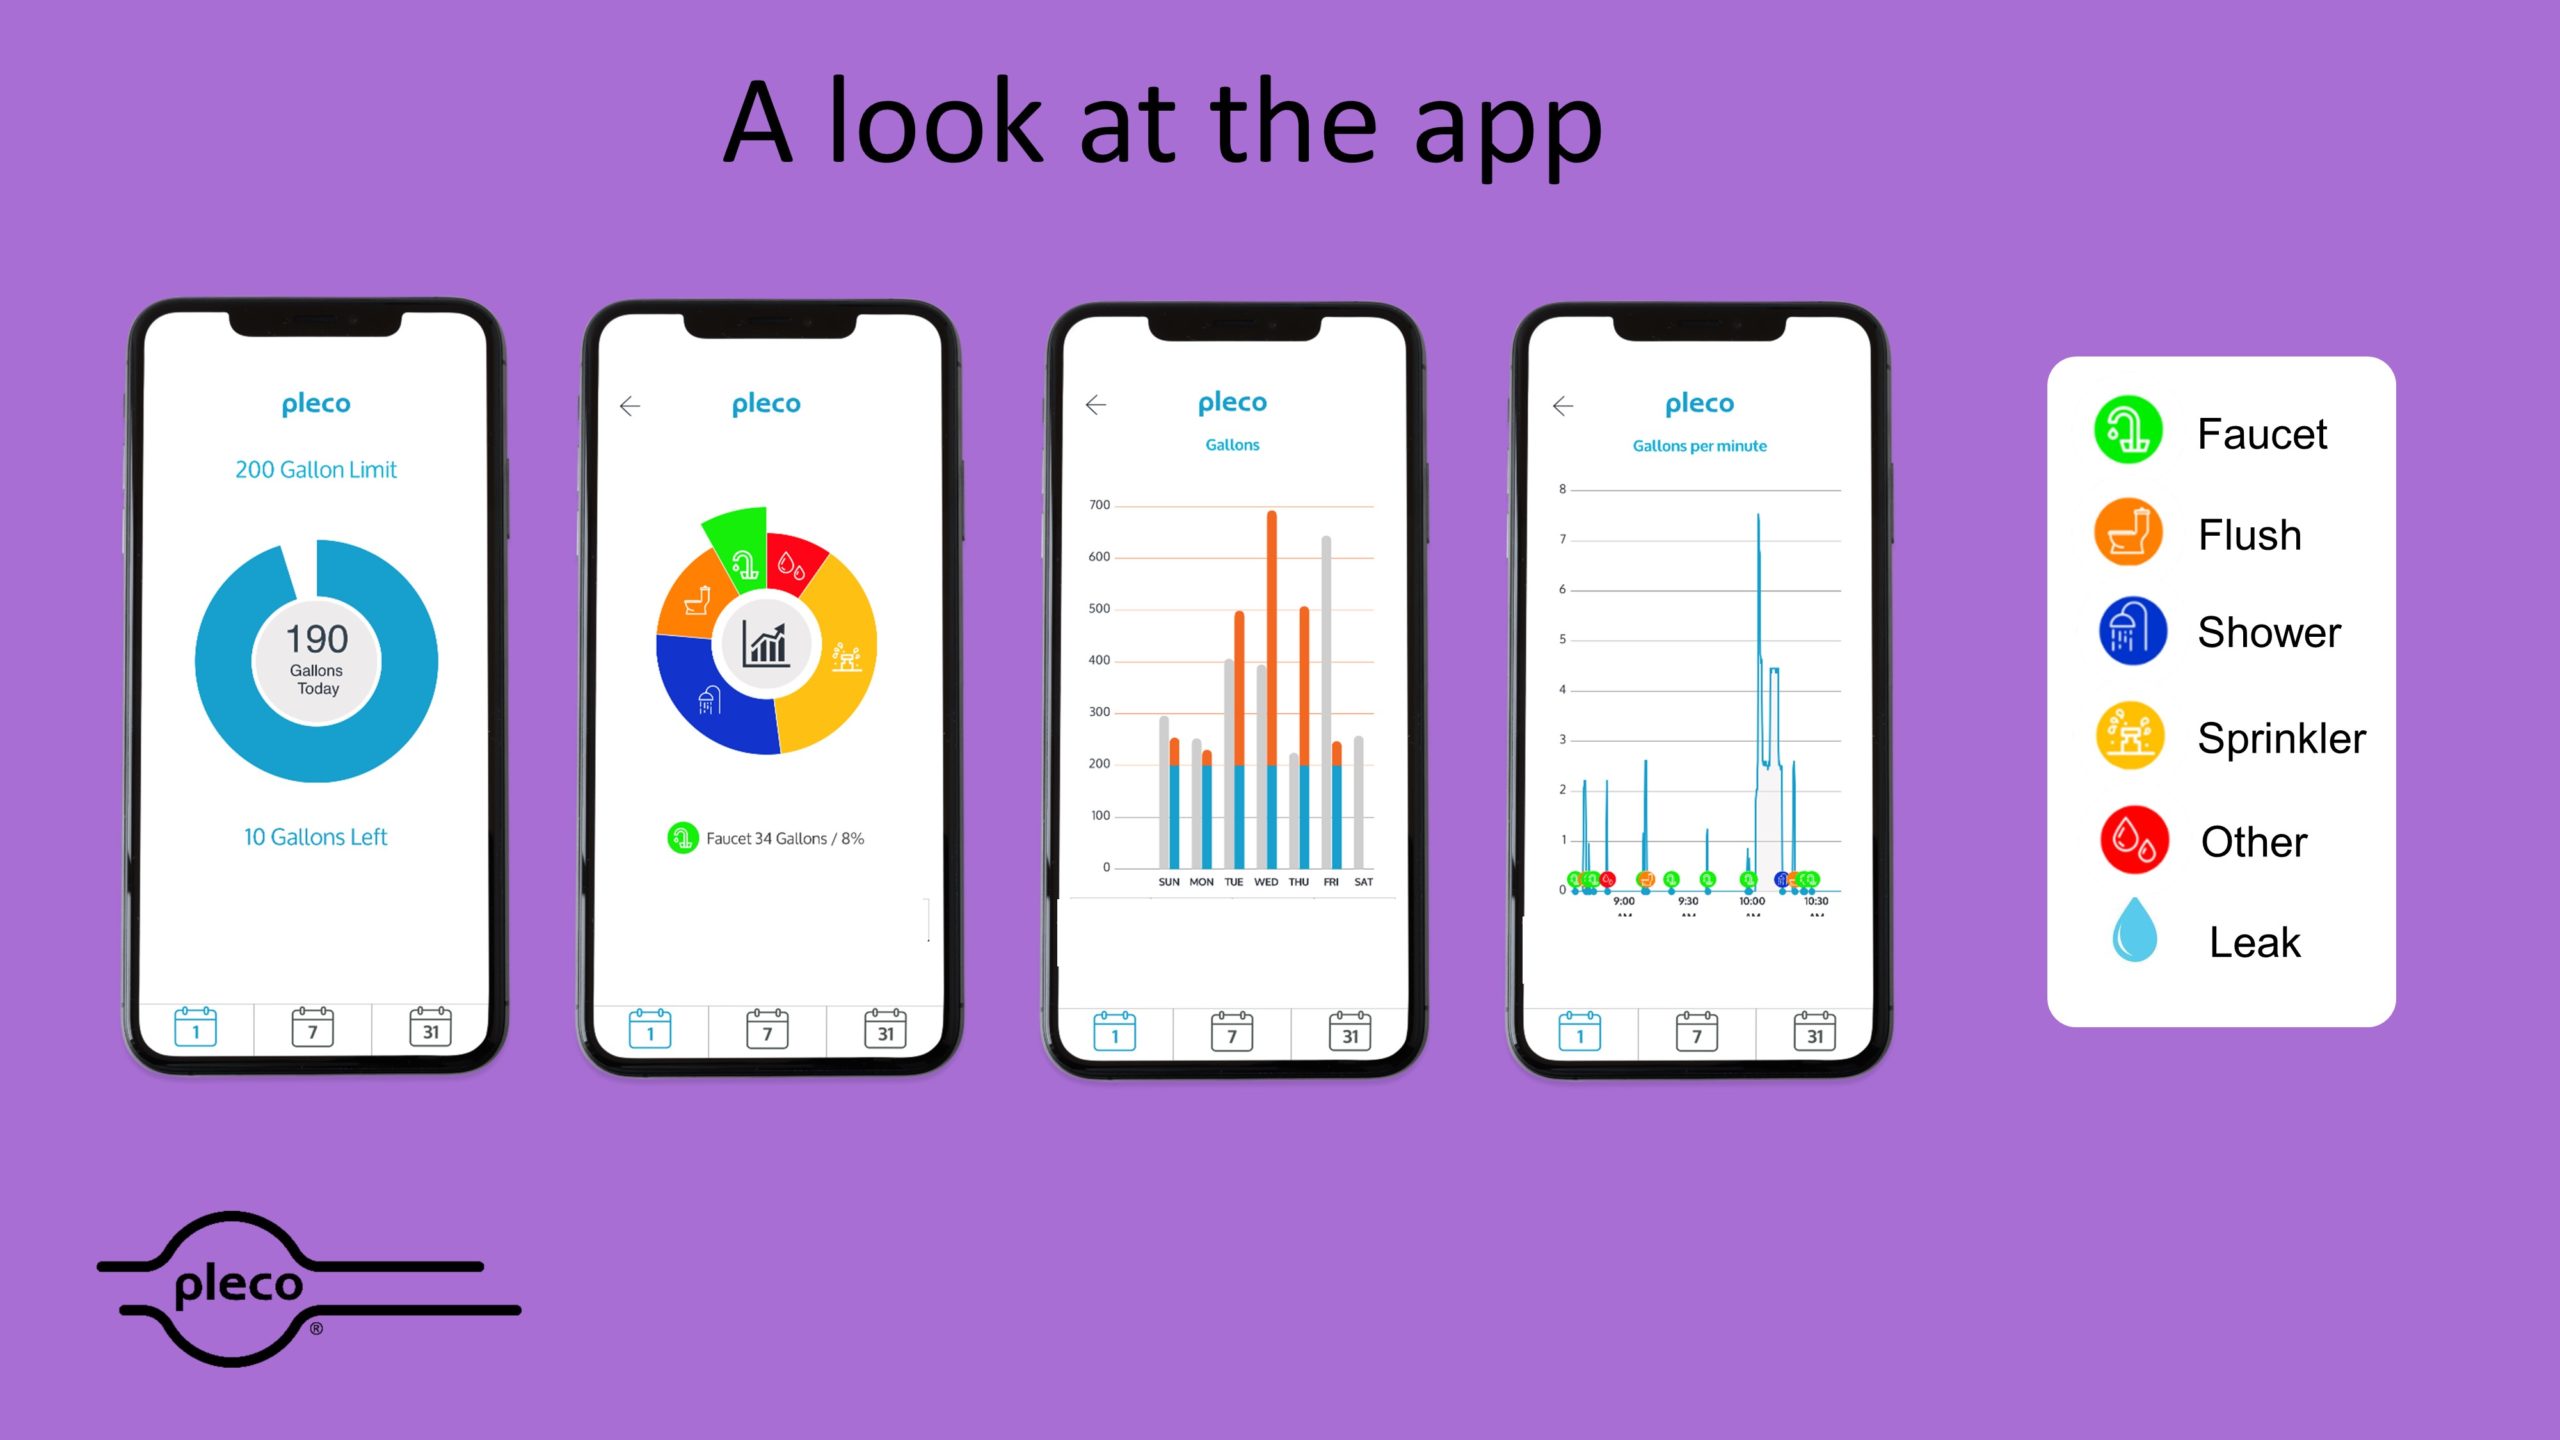
We worked hard designing the app, ensuring that it is both aesthetically pleasing and easy to use. You can see water use in multiple ways, find the screen that you like the best!
Referring to the picture above and starting from the left:
Screen 1 is the home screen: See your overall water use and set your own custom daily limit. The Leak Alert icon will also show in this screen if Pleco detects a leak. Use the icons on the bottom of the screen and the circle in the center to navigate to the other screens.
Screen 2 shows where you used water. Click on any of the parts of the wheel to see water use by specific category. Pleco can tell the difference in use between faucet, showerhead, flush, irrigation, and miscellaneous (other). You see this information for various periods of time: Daily, weekly and monthly.
Screen 3 shows when you used water during the day, the week and for each month. It will also show you a comparison with the previous time period, so you can understand water usage trends. The graph will change color from blue to orange if the usage exceeds the limit.
Screen 4 shows the flow rate history showing in real-time the various water usage events identified with colored icons that show the kind of water use and when it happened. With live updates, you will see the water use as it happens. Get to this screen by touching the central circle on the home screen.
The settings screen (not shown in the figure) allows you to change various settings and contains product information. It can be reached by selecting the bottom right icon on the home screen.


